Put Your Money Where Your Mouth Is: Built For the Postseason Edition
sports
baseball
math
Author
Zander Gordan
Published
March 14, 2024
The 2024 MLB season is almost underway, and oddsmakers have set their predictions for the season.
library(tidyverse)
── Attaching core tidyverse packages ──────────────────────── tidyverse 2.0.0 ──
✔ dplyr     1.1.4     ✔ readr     2.1.4
✔ forcats   1.0.0     ✔ stringr   1.5.1
✔ ggplot2   3.4.4     ✔ tibble    3.2.1
✔ lubridate 1.9.3     ✔ tidyr     1.3.0
✔ purrr     1.0.2
── Conflicts ────────────────────────────────────────── tidyverse_conflicts() ──
✖ dplyr::filter() masks stats::filter()
✖ dplyr::lag()    masks stats::lag()
ℹ Use the conflicted package (<http://conflicted.r-lib.org/>) to force all conflicts to become errors
df <-read_csv("2024seasonOdds.csv")
Warning: One or more parsing issues, call `problems()` on your data frame for details,
e.g.:
  dat <- vroom(...)
  problems(dat)
Rows: 30 Columns: 3
── Column specification ────────────────────────────────────────────────────────
Delimiter: ","
chr (1): team
dbl (1): Ewins
num (1): OddsWS

ℹ Use `spec()` to retrieve the full column specification for this data.
ℹ Specify the column types or set `show_col_types = FALSE` to quiet this message.
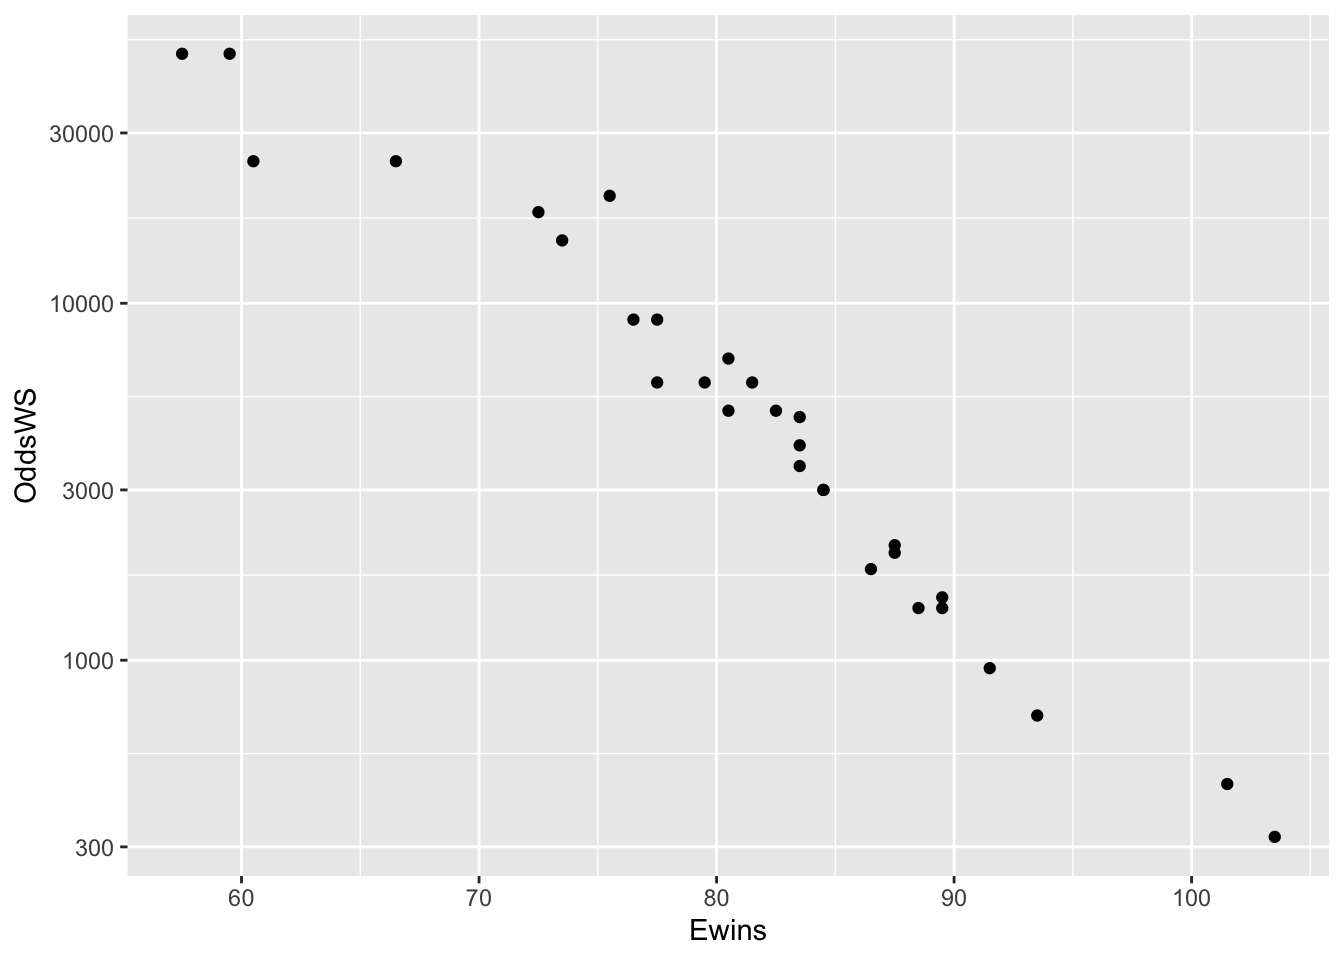
I have collected the odds from Fanduel on each MLB team’s over/under for total regular season wins, and the odds of the team winning the world series. How do these correlate?
df %>%ggplot(aes(x = Ewins, y = OddsWS)) +geom_point() +scale_y_log10()
It seems that there is pretty much a log-linear inverse relationship between expected win total (technically an over under is not the same thing as an expected value, but I will use the terms interchangeably) and your winnings from betting the team to win the world series. Notably, for the worst teams, you do not win as much for betting on them as you might expect, no doubt the oddsmakers want to limit their potential downside from those who are attracted to the most outrageous bets.
I think it may be useful also to convert the odds to break-even win probabilities:
library(plotly)
Attaching package: 'plotly'
The following object is masked from 'package:ggplot2':

    last_plot
The following object is masked from 'package:stats':

    filter
The following object is masked from 'package:graphics':

    layout
Now we get a positive log-linear relationship, which is more intuitive. I will note that there really are not any extreme off-diagonal outliers here. A dot far up and to the left in this plot would represent a team “built for the playoffs”, that is having a much better chance of winning the World Series than their regular season projections would suggest. As far as Vegas is considered, there really are no such teams. The closest would be the Red Sox, with a 1.2% chance compared to the 0.8% chance of the Marlins, despite having the same expected wins 77.5 wins, or put another way the same chance of winning as the giants who have 81.5 expected wins.
So, are there any teams that are uniquely “built for the playoffs?” If you think there is, maybe you should bet on them to win it all. Otherwise, if “built for the playoffs” is just a verbose way of saying “good,” then maybe we should retire the phrase.